In hindsight, 2010, uncomfortable as it was for some, may be looked back upon in time as the year when the global demand for diesel generating sets started to return to its more traditional pattern of growth
Some will look back on 2010 as the year when the global demand for diesel generating sets began to return to a more traditional growth pattern. Long gone were the heady days of 2008 when the world consumed over 635,000 gensets above 7.5kVA with a value in excess of $12bn and an aggregate output of 78,000 MWe; 5 per cent higher than 2007, when global consumption above 7.5 kVA reached 75,000 MWe. In 2008 a further 520,000 diesel generating sets below 7.5 kVA were consumed, but represented less than three per cent of the total capacity in megawatt output. However, 2009 heralded significant changes.
With the continuing movement in exchange rates over recent years, the predominant volume of small generating sets below 7.5 kVA, and a significant differential in the price of generating plant produced in the western and eastern hemispheres, it is has become more practical to measure demand in terms of aggregate generating capacity i.e. megawatts electrical (MWe), rather than of currency. In this article, therefore, MWe will be used as the critical measure of consumption, exports and imports within the relevant power bands.
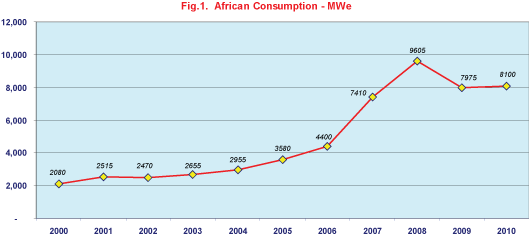 The pattern of demand in Africa followed the overall global trend, with demand rising rapidly throughout 2007/8, then falling back in 2009 and remaining relatively flat in 2010 (Fig.1.). But the key difference is that during the last ten years demand in the African continent had been growing at almost three times the rate of global demand, which had been rising annually at 6 per cent per annum. Prior to this period the African market had grown at 11.4 per cent annually but last year, 2010, was only 1.6 per cent
In 2010 the African continent accounted for 11 per cent of worldwide demand, slightly less than the previous year. Whilst the number of generating sets consumed declined to 99,255, the aggregate output increased marginally from 7,975 to 8,100 MWe - in value $1.35bn (Fig.2.). 
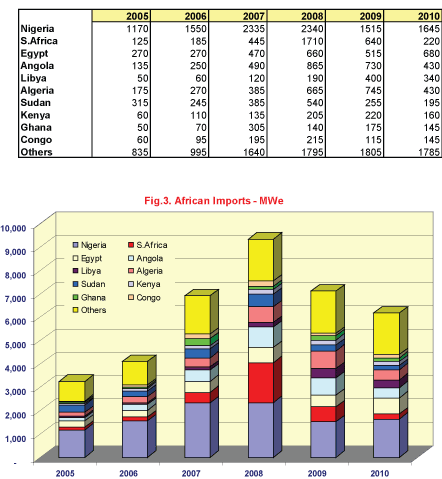
Unlike Europe, the Americas and the Far East, there is little domestic production of significance in Africa with the exception of countries like Nigeria, South Africa, Egypt, Algeria and Morocco. Consumption, therefore, varies little from imports. By comparison with 2008 there were 27,000 less generating sets imported into the African continent during 2010, totalling 88,000 in number and having an aggregate generating capacity of 6,175 MWe (Fig.3.). Despite this slow down, the trend for imports during the past five years still indicates an impressive underlying growth rate of 16 per cent year on year, so the future opportunities for exporters remain promising.
African imports accounted for 14.5 per cent of the global export trade, and one third of these were for generating sets having an output greater that 750 kVA. Traditionally the African market had neither been a large producer nor importer of sets in this range. Fig.4. analyses these imports by power band in 2010.
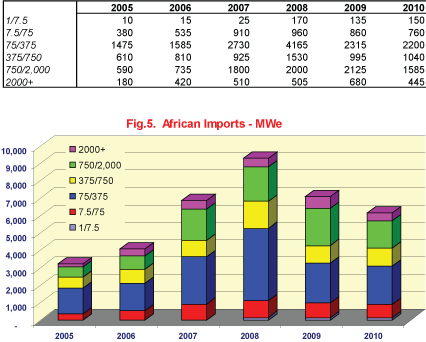
Perhaps the most noticeable aspect is that whereas worldwide demand, as well as exports from the major producing countries, showed distinct signs of recovery in 2010, Africa’s imports continued to decline by 13 per cent when compared with 2009. Despite this, the growth trend for imports over the last five years has been in double digits. Whilst the volume of imports of generating sets in the 1-7.5 kVA range are very high, they represent an insignificant percentage of the total aggregate generating capacity (Fig.5.). Sets with ratings in excess of 375 kVA were mostly in demand.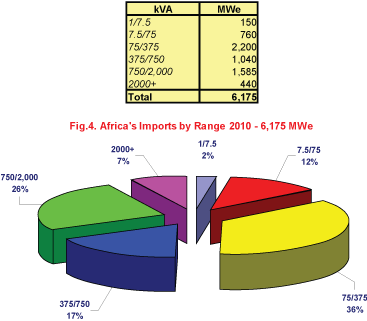
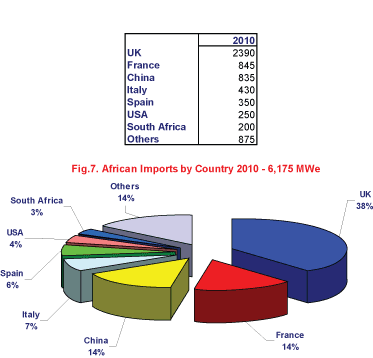
The United Kingdom remained Africa’s largest supplier in 2010, though their overall share of the market dropped from 41 per cent in 2008 to 38 per cent in 2010. Even so 19,450 sets were exported by the United Kingdom to Africa, compared with 33,200 in 2008 (Fig.6.). Demand for sets in the range 75-375 kVA were the most affected. This seems to have been a pattern for most international suppliers as African imports in this range declined by a third over the course of two years. Plant above this output held up better.
Since 2008 China has emerged as the largest volume supplier to Africa. The number of sets exported in 2010 was 34,115. This was 8,400 less than 2008. The majority of these were of low output; over 31,000 in the range 1-7.5 kVA. In terms of generating capacity the aggregate of 835 MWe in 2010 was half the level of 2008, due to the dramatic fall in the export of sets between 75 and 750 kVA. Whilst China may numerically export more diesel generating sets to Africa than any other country in the world, it is still does not surpass France as the second largest supplier when measured in generating capacity. China’s market share also declined over the past two years from 17.6 to 13.5 per cent.
France
 In 2010 France exported a total of 11,000 gensets to the African continent, mostly to the francophone area and almost identical to the previous year. In MWe output this was a third less that 2008 and 10 per cent less than 2009, mainly due to a fall in exports for generating plant above 750 kVA, and more particularly in the range 2,000+ kVA. France, however, managed marginally to increase its market share to 13.7 per cent.
Other significant exporters to Africa have been Italy, Spain and the USA, but none have yet achieved a market share in double digits. South Africa is also emerging as an exporter to neighbouring African countries. 
The top five exporters – UK, France, China, Italy and Spain now account for 78 per cent of all exports to Africa. When the next five countries are included – USA, Lebanon, South Africa, Turkey and India – the total rises to 92 per cent. Japan, formally a major exporter to the region is no longer a significant supplier (Fig.7.)
Consumption
In 2010 the six largest consuming countries were Nigeria, South Africa, Egypt, Algeria, Angola and Libya, two of which are now experiencing both political and economic unrest. Together these countries represent 60 per cent of African genset consumption (Fig.8). As for imports, the top 10 markets accounted for 71 per cent of the total in 2010 (Fig.9).
 Nigeria has 5,900 MW of installed generating capacity but the country is only able to generate for 36 per cent of the time because many of its facilities have been poorly maintained. Nigeria regularly exports electrical power to neighbouring Niger, and though the country experiences regular power failures, several large thermally fired power plants have been scheduled for retrofitting. Although Nigeria has plans to increase access to electricity throughout the country, it is unlikely that the requisite generating capacity and new transmission lines will be installed in the short term. Whilst there is talk of a programme to install photovoltaics to serve rural areas, the cost of this is likely to be disproportionate to more conventional solutions. As only 10 per cent of rural households are connected to the grid and a large percentage of the population have little access to electricity, the demand for diesel generating plant is likely to remain buoyant in the foreseeable future.
Although Nigeria has failed to diversify the economy away from its overdependence on the capital-intensive oil sector, which provides 95 per cent of foreign exchange earnings and about 80 per cent of budgetary revenues, the number of generating sets imported into Nigeria since 2005 doubled from 8,500 to 17,000 by 2010. By far the largest African market, with a population of 260mn, it consumes twice as much generating plant as the second largest market, South Africa. However, despite the presence of a growing domestic market for locally assembled products, the greatest increase in imports has been for sets below 375 kVA. Following the boom years of 2007/08 imports declined steadily from 30,000 units in 2008 to 17,000 last year i.e. from 2,340 MWe to 1,645 MWe. Just over half of these had an output exceeding 375 kVA. Although demand has fallen sharply during the past two years the underlying growth trend remains positive and is supported by the increase in GDP between 2007 and 2010 due to increased oil exports and crude prices.
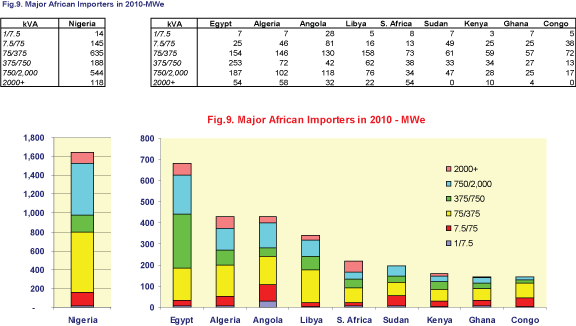 During the first decade of the new millennium South Africa’s strong economic growth, rapid industrialisation and a mass electrification programme resulted in demand for power outstripping demand by early 2008. As a result the state energy company Eskom embarked on a massive programme to upgrade and expand the country's electricity infrastructure. Whilst these plans include the construction of a new generation of power stations to come on stream in 2013 the shortages remain. Since 2005 an additional 4,450 MW has already been installed and Eskom plans to almost double its generating capacity of 44,000 MW to 80,000 MW by 2026. In the meantime suppliers of diesel standby and base load sets have expanded rapidly. The power shortages had the effect of doubling the consumption of diesel gensets in 2008 to 15,000 units, since when demand has fallen back to 8,000. Imported generating sets are a diminishing element of the market and in recent years South Africa has emerged as an exporter to neighbouring markets, an activity likely to grow in future years. Since the power crisis of 2008 imports have declined from 13,000 to the pre crisis level of 3,350 units per annum with a generating capacity of 220 MWe.
Egypt, whilst a producer, imports the majority of its generating sets. During 2010 a total of 4,630 sets were imported having an aggregate generating capacity of 680 MWe. Although both China and South Africa were high volume suppliers of sets below 7.5 kVA, the United Kingdom was their dominant partner meeting over 50 per cent of the demand, especially in the range 75-2,000 kVA. The centre of gravity of the Egyptian market lays in the band 75-375 kVA and accounts for 37 per cent of demand. Imports over the last five years have been growing at a rate of 22 per cent per annum and 2010 was no exception. With the political changes in Egypt, as indeed in other North African states, it is difficult to predict the level of trading in 2011. Egypt, though not an oil producer, acts as an important link between the oilfields in the Persian Gulf and markets in Europe via the Suez canal.
Algeria's economy remains dominated by the state but gradual liberalisation since the mid-1990s has opened up more of the economy. Although in recent years Algeria has imposed restrictions on foreign involvement in its economy it has the eighth-largest reserves of natural gas in the world and is the fourth-largest gas exporter. Imports of generating plant took a nosedive in 2010 falling by 42 per cent, very much against the trend of the previous four years when growth had been 25 per cent year on year. France was the largest supplier to the market with an 18 per cent share, closely followed by Italy, Spain and the United Kingdom. Both China and India now supply the market with smaller units, but China is visibly making inroads in the 250-375 kVA range.
Oil sector attracts power
As expected, it is the oil producing countries of the African continent where the biggest demand for diesel power plant is to be found. Although Angola has suffered three decades of civil war, and only in recent years been able to begin the slow process of rebuilding both the physical and social infrastructure, the electricity network is still problematic, particularly in rural areas. Whilst the government has set high priorities for electrification, the underlying demand for generating plant remains strong, even though the global recession temporarily stalled economic growth. Until the end of 2008 the market had been growing at 25 per cent per annum. Peaking in 2008 with the importation of 15,000 units - 860 MWe – the demand for gensets declined throughout 2009/10. By the end of 2010 it was down to 10,950 units with an aggregate generating capacity of 430 MWe. Whilst there remains a high volume demand for gensets below 75 kVA the core of the business is between 75-2,000 kVA. This represents two thirds of the market.
Future demand
The Libyan economy depends primarily upon revenues from the oil sector, which in the past have contributed about 95 per cent of export earnings and 25 per cent of GDP. Once international sanctions were lifted in 2003 the market for generating plant grew rapidly. Presently the sixth largest market on the African continent, Libya more than trebled its demand in the three years from 2005 and 2008, then doubled its consumption again in the next year before falling back to 340 MWe in 2010. The greatest demand has been for generating sets in the range 75-375 kVA, these representing nearly 50 of the total.
When projecting future demand, installed generating capacity and electrical consumption in billions of kilowatt hours can often give an indication of how demand for standby and base load diesel generating plant might develop. The installed capacity for the 50 plus countries of the African continent is 122.5 gigawatts, not quite 3 per cent of the world’s generating capacity. Thermal power, which is predominant, is 78 per cent and hydro 18 per cent. The contribution of renewables, other than hydro is negligible. Of the total installed capacity two countries - South Africa and Egypt - account for 54 per cent. If Algeria, Libya, Morocco and Nigeria are added it increases to 75 per cent.
Wind of change
For the past 10 years electricity consumption in Africa has been rising at an average rate of 4.8 per cent each year. Despite the very low growth in 2008 it is likely to have reached 550/570 billion kilowatt hours by the end of 2010 – official figures are still awaited. Overall the continents load factor i.e. the ratio of consumption to installed capacity is 49 per cent i.e. quite high. South Africa and Egypt, the major markets, consume 321bn kilowatt hours. The consumption of electricity in Africa, a continent of one billion people, is just over three per cent of the world total. Given the substantial growth for standby and base load diesel power units in recent years, there remains optimism for sustained growth to continue.
Although a ‘wind of change’ was blowing towards the end of 2008, the effect on the world generating set market had not been dramatic. The world had consumed 1.16mn diesel engine driven gensets with a value in excess of $14bn and an aggregate generating output of 80,000 MWe. Of these 241,000 were produced in Europe, 143,000 in the Americas and 761,000 in Asia. However, 2009 saw significant change.
After six years of continual growth, most dramatically during 2007/08, the decline in worldwide consumption in 2009 of 13 per cent brought the market back with a bump to reality; back almost to its historic trend line. Over the past 15 years the market had grown at an annual compound rate of five per cent per annum, almost two percentage points higher than the growth in worldwide electricity consumption.
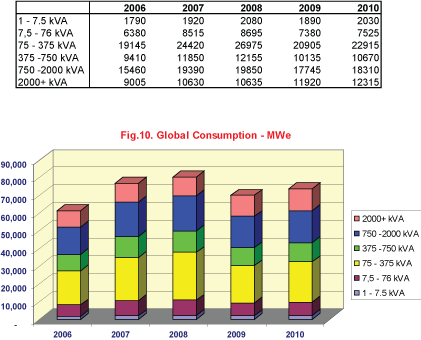 Although the reduction of 13 per cent in global demand in 2009 was substantial, it was possibly not quite as bad as at first anticipated. Slightly in excess of one million generating sets having an aggregate capacity of just under 70,000 MWe were sold by comparison with 80,000 MWe the previous year. Last year, 2010, worldwide consumption recovered to 1.06mn generating sets with an aggregate generating capacity of 73,765 MWe and a value of $12.5bn, an increase on 2009 of 5.4 per cent. Based upon consumption during the past five years compound annual growth is now at a level of 5.3 per cent. (Fig.10).
Despite increasing production in many of the world’s emerging markets, imports still form a significant element of total consumption. In 2009 over 417,500 generating sets valued at $6.75bn with an aggregate output of 42,400 MWe moved across national boundaries. Although this was 60 per cent of global consumption it was still 23 per cent lower than 2008. Above 750 kVA three quarters of all generating sets consumed were imported from the major producing countries, highlighting the continuing dependence of many emerging and developing nations on imports for larger plant. Below 375 kVA the ratio was 45 per cent.
By 2010 exports had increased to 470,000 units, but with only a marginally higher generating capacity of 42,720 MWe and value of $7bn (Fig11). Whereas the demand for gensets with an output below 750 kVA grew by 14 per cent, units above this rating declined by 11 per cent on the previous year.
During the past few years one of the most significant aspects for the industry has been the emergence of China as a major genset producer, and more latterly as a competitive exporter. From small beginnings a few years ago it has become the world’s third largest exporter gaining a 14 per cent share of the market. This has been to the detriment of other exporters, including the United Kingdom who has seen its share of the global export market decrease over the past five years.
Despite the significant downturn in world trade during 2009 there remains a positive and underlying growth trend. Having witnessed a distinct, but not remarkable, recovery in 2010, we can expect the global market progressively to return to the level of 2008 by the end 2012, or at worst the first half of 2013. However, by that time it is likely that the ratio of exports to consumption will be less as the production of emerging countries increases to meet domestic demand.
Gerald Parkinson
Acknowledgements: Data for this article is provided from GENSTAT. For more information contact George Williamson at Parkinson Associates - Tel. 01452 534 388 or e-mail


